For an overview of return on investment, see the white paper, Using Return on Investment to Evaluate Project Management Training. It would be helpful to understand the process of conducting a study prior to reading the specifics of a business impact and ROI study for the XYZ Widget Manufacturing Leadership Development Program. At the end of this post are some reference books if you are interested in business impact and ROI.
Phillips ROI Methodology™ Brief Overview
The ROI Methodology™ was developed by Jack Phillips in the 1970’s, refined through application and use in the 1980’s, and implemented globally during the 1990’s. (Phillips, Phillips, Stone and Burkett, 2007)
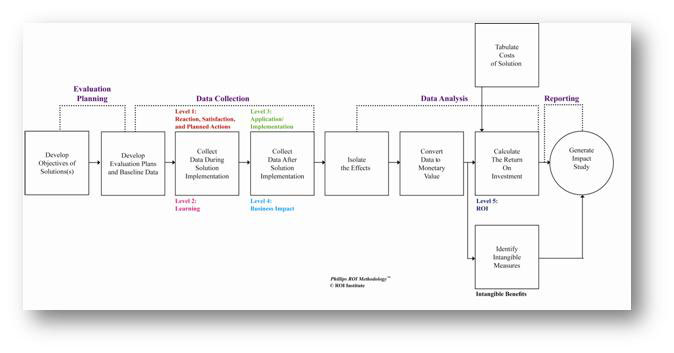
The Phillips ROI Methodology™ encompasses four major phases:
- Evaluation Planning
- Data Collection
- Data Analysis
- Reporting
See Exhibit 1 below, Phillips ROI Methodology™ Copyright ©ROI Institute, Inc.

Case Study
Using the Phillips ROI Methodology™ to Evaluate the XYZ Widget Manufacturing Company Leadership Development Program
The XYZ Widget Manufacturing Company Leadership Development Program was a good choice for a business impact and ROI study as it met the following criteria:
- Long program life cycle
- The program ran over a two year time period and was expected to be a ongoing program within the company
- Program linked to organizational strategic goals
- The goal of the program was to groom high potential employees for future leadership roles within the company
- Executive interest in the evaluation
- The executives were interested in evaluating the success of the program to determine if it was worthwhile to continue on a long term basis given the necessary investment in the program in both resources, money, and time
- High cost program
- The program cost $350,000 for the initial rollout of the pilot group (30 individuals initially)
- Program with visibility throughout the organization
- The program had high visibility through the organization given the investment of money, time and resources
Approval was given by the Executive team and the Board of Directors to proceed with the ROI study.
We’ll follow the four phases mentioned above in discussing the details of the business impact and ROI study of one particular small group – the manufacturing function high potentials – of the leadership development program at XYZ Widget. This first part will focus on Phase 1: Evaluation Planning. The other phases of this project will be covered in subsequent posts (2 – 4).
XYZ Widget’s leadership program consisted of the following core courses:
|
|
Additionally, depending on the particular functional area the individual was associated with, he or she took additional courses specific to that functional area. In many cases, individuals were cross-trained in functional areas. For example, an individual may have taken classes related to manufacturing, planning and procurement and the material management functions. See the first post, Developing a Leadership Training Program for High Potentials: A Case Study, for details on the other courses related to the specific functional area.
All participants, upon completion of the program, were put into a formal mentoring program where an executive of the organization guided them as they developed their skills and worked toward become leaders within the company.
Phase 1: Evaluation Planning
Phase 1 of the study entailed developing the ROI analysis plan and project plan to move forward with the business impact and ROI study.
In addition to specific measures for the workshops the participants attended as a whole, each participant in the program had specific goals they were working toward which were aligned to their specific functional area. The goal of the study was to ensure that the individuals who made it through the intensive leadership program had the skills necessary to lead the organization.
The first goal was to develop the particular objectives of the leadership program. Each participant had their own objectives, which were developed in conjunction with current leaders within those functional areas. Hence, various measures were identified based on the particular functional area. There were many measures for the manufacturing function, however, for purposes of this example and to keep it manageable, only one major measure will be discussed in this and subsequent posts:
- Improvement in processes to meet increased demands for product
- Improved communication between manufacturing, planning and procurement management, and material management functions (improved communications between these three closely related functions would help to increase the production of widgets to meet growing market demand)
5 individuals from the pilot group of 30 took workshop related specifically to the manufacturing function area and these participants are discussed in this example. These measures were part of each individual’s Action Plan and each individual worked with his/her mentor for guidance. The individuals were expected to work as a team to accomplish the goals within the manufacturing function, under the guidance of their mentors and the current executives within the function.
As part of the data collection plan, the following was delineated:
| Level Evaluated |
Program Objectives at Level |
Measures |
Data Collection Methods |
Data Sources and Timing |
|
1 |
Questionnaire to gauge reaction/satisfaction to training program
|
8 out of 9 on a 9-point rating scale | Questionnaire |
Participants End of program |
|
2 |
Learning demonstrated in program
|
Development of a detailed action plan to meet various measures Score of 80% out of 100% on exams Full participation in all classroom activities |
Action Plans Exams – 1 per course Observation |
Participants End of program Facilitators/ Participants End of each course Facilitators |
|
3 |
Application of learning after program ends
|
Action Plan progress Progress toward process improvement initiatives |
Action Plan Questionnaires to Manufacturing function Executives, mentors, and participants |
Participants/ Mentors Within 3 months – progress on Action Plan made Question-naires sent to executives, mentors and participants within 3 months |
|
4 |
Business impact
|
10% increase in production of product to meet growing needs |
Production Reports Questionnaires, including of other functions to determine improvement in communication |
Participants/ Mentors/ Current Executives – increase in production to 10% within 6 months |
The ROI (level 5) was forecasted at 25%.
ROI Analysis Plan
It was determined that the data item to be measured would be production (as shown above in the data collection plan). The goal was a 10% increase in widgets produced per day within a 6 month time period.
Since there were two production lines; one production line would be managed by a control group of 5 individuals who had not yet been given the training and the mentoring which was a component of the program. Hence, a control group was used to isolate the results of effects of the training toward meeting the goal of a 10% increase in production.
The composition of the control group was similar to the "real group" of 5 individuals:
| "Real Group" of 5 Individuals |
Control Group of 5 Individuals |
|
|
The method to convert the data to a monetary value for the purposes of the study would be output – the number of widgets produced and the increase in productivity. Additionally, increase in profit was expected due to increasing customer demand.
Intangible benefits expected included:
- Improved teamwork and communication between manufacturing, planning and procurement management, and materials management functions
- Increased customer satisfaction due to demand being met
- Increased job satisfaction due to improved teamwork
The following major cost categories were identified:
- Design and development of training program, including needs assessment and preparation time
- Fees for facilitators and rental of training rooms, including A/V equipment
- Fees for materials
- Meals for participants
- Participant salaries and benefits
- Mentor salaries and benefits
- Evaluation and data gathering/analysis time (cost of the study)
Other considerations: There were a few process improvement initiatives underway at XYZ Widget, but they were incomplete and very little progress had been made. There was no concentrated effort being made to improve processes, likely due to employees trying to meet an increased demand for product.
Communication of the Business Impact and ROI Process and ROI Study
Significant support was needed by many individuals from within XYZ Widget to ensure a successful ROI study, including:
- Executive team
- Mentors
- Board of directors
- HR department (for data gathering)
- Learning & development group
- Participants in the program
A communication plan was rolled out which included:
- Executive session – 1 hour session to discuss the planned program and the business impact and ROI study
- Interoffice memo to all participants in the training program – describing the business impact and ROI study, including information on:
- Purpose of study
- Expectations for completion of Action Plans and Questionnaires
- Steps in process of conducting the study
- "Lunch and Learn" for all participants in the training program to review memo, answer questions and kick-off the program and ROI study
- Introduction of mentoring program
The communication plan was detailed to ensure buy-in and cooperation from participants. By communicating ahead of time and explaining the process in detail participants felt more comfortable with their participation and how the data would be used.
In Part II: Data Collection will focus on the collection of data for levels 1 – 4 and the use of action planning.
References
Next post: Part II Data Collection


Hello Harjit – I wrote a white paper that uses the formula. You can find it here and it may provide you more guidance for what you are doing: https://www.ginaabudi.com/articles/using-return-on-investment-to-evaluate-project-management-training/.
Also – two books which may guide you include:
Phillips, J., Phillips, P., Stone, R., and Burkett, H. (2007) The ROI Field Book: Strategies for Implementing ROI in HR and Training, Massachusetts: Butterworth-Heinemann/Elsevier
Phillips, J. and Stone, R., (2002) How to Measure Training Results: A Practical Guide to Tracking the Six Key Indicators, New York: McGraw-Hill
Hope you find this of value. Good luck with your project!
Dear Gina,
I have been asked by the management to provide return on investment for hiring a consultant to support in the productivity of the workshop and how much return in turnover will this bring to the company. I have seen loads of web sites but non of them have a calculation template of method. Please let me know if there is a possible to give me some guide lines on how to calculate and convince the impact on my management.
Hi Shay,
I have a general sample of a completed communication plan along with a downloadable template you can access here: https://www.ginaabudi.com/templates/communication-management-plan-template/.
Best regards,
Gina
Do you have sample of an entire communication plan. I am taking an ROI class and having a difficult time putting this together